|
PAIR WISE COMPARISONS OF TREES
Topological changes
- Did anything change, in general, or in a
sub-tree? Were there small changes or major changes?
Qualitative indications of the magnitude of
the differences between the two trees or sub-trees will be indicated by the
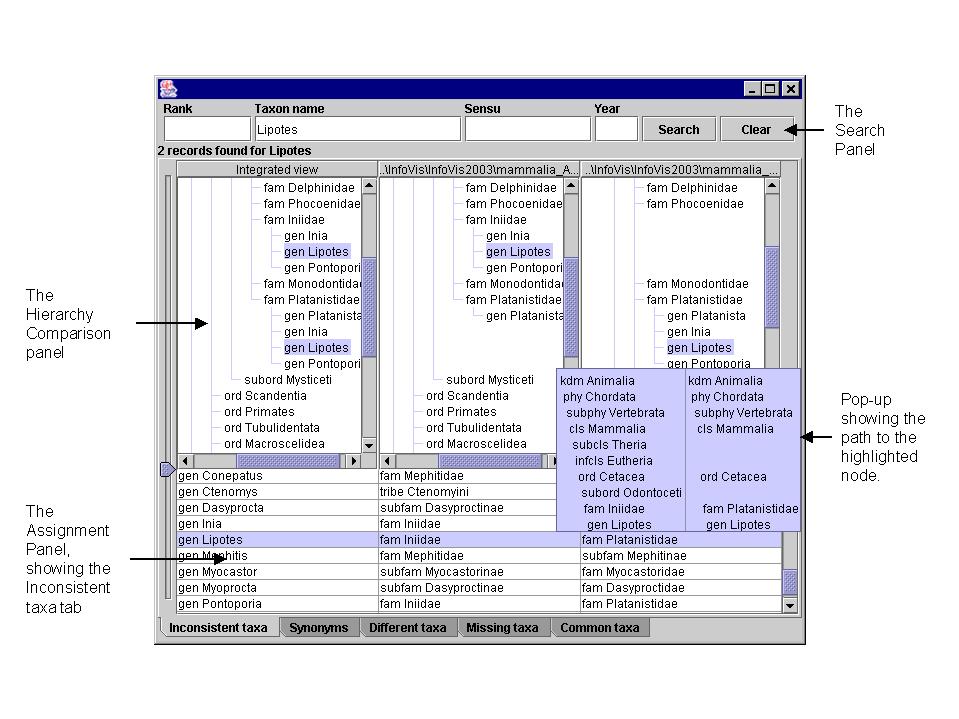
number of entries in the Assignment panel. Trees that are very similar will
have many entries in the Common taxa tab and
few entries in the other tabs (particularly the Different taxa tab). Conversely, trees that are
very different will have few entries in the Common
taxa tab and many in the Different
taxa tab. The nature of the changes (small versus major) often requires
judgement on the part of the user (in our case, taxonomists) as to the
importance of the change.
- What nodes were added, deleted?
Nodes that were added or deleted from one
tree are deleted or added, respectively, in the other tree. These simple
differences between two trees are listed in the Missing taxa tab in the Assignment table.
- Did any node or sub-trees "move" in the
tree. Can you characterize those movements?
Entries in the Different taxa tab indicate movement, in other
words, nodes which have different linkage (paths to the root node) in the two
trees. Highlighting an entry in the table will show the node in the hierarchy
display panel. If the sub-tree moves en masse (so that the root of the sub-tree
has a different parent), then just one difference will be recorded: that the
root node has different parents in the two hierarchies. If the sub-tree
fragments as it is moved, so that nodes in the sub-tree end up in different
places, then each difference will be recorded in the
Different taxa tab.
Attribute value changes
- Global impression: did things change a lot
or not?
The TaxoNote Comparator is designed to
manage the Latin name and the rank from the classification data sets. Its
primary use in the comparison of two trees lies in distinguishing between
similar nodes and in resolving conflicts between the two trees. In order to do
this with some degree of confidence, many more attributes than are available in
the classification data sets are required. (Principal among these is the
authority for the name, in other words, the author of the publication where the
name first appeared.) In the context of taxonomy, changes in attribute values
are recorded in the Synonyms tab of the
Assignment panel (two nodes which are compatible but having different rank or
name).
- What nodes or sub-trees changed the most?
A visual scan of entries in the
Different taxa tab will show which entries
have changed, but not by how much. Hence we can detect where the differences
lie, but not their magnitude.
- Did the value of attribute XYZ for this node
increase or decrease? in absolute terms, or relatively to other siblings or
other nodes?
Attributes that could be interpreted
numerically, such as those having integer values are not handled in a different
way by our software. Therefore we are able to detect that the value of the same
attribute from two nodes is different, but we are not able to interpret this as
an increase or decrease.
GENERAL VISUALIZATION OF TREES
Topology
- Overall characteristics: How large is the
tree? How many levels deep? What is the deepest branch? Does the depth vary
between sub-trees or not?
The overall characteristics of the tree
such as those given above, are obtainable by inspection. It would be possible
to calculate such metrics for each of the trees involved in the comparison but
this has not been implemented yet. We envisage taxonomists using metrics these
metrics in determining which trees are largest (covering the most taxonomic
ranks), hence are most likely to be the product of taxonomic revisions.
- Path: What is the path of this node?
The path to a node is displayed in the
popup in the hierarchy display panel.
- Local relatives : what are the children,
siblings or cousins of this node?
A pop-up could be implemented to give this
information. However, since the hierarchy display window will always display
nodes legibly, this information can be obtained by inspection of the
hierarchies.
- Filtering by level: e.g. show me only the
first level, or show only 3 levels down, or removes all the leaves
Since expansion and contraction of the
hierarchy is under user control, manual filtering by level is possible.
- Topologies question that involve counting
nodes can be seen as attribute dependant questions: e.g. Which branch contains
the largest number of nodes? or Which branch has the largest fan-out?
At present these topological functions are
not addressed explicitly in the TaxoNote Comparator although they may be added
in later versions of the software.
Attribute based
Those tasks only occur when leaf nodes have
attributes that can be aggregated at the parent level.
- Find nodes with value Y of categorical
attribute X - What value of a categorical attribute occurs more often? e.g. Are
there more farm animals or pets
One of the Assignment Table tabs that we
intend to implement post-InfoVis is a general Search Results tab. Such a tab
would record all the results of a search, allowing answers to questions of this
nature to be addressed.
- Find nodes with certain values of two or
more attributes e.g. what video file is used the most
At present our search facility does not
allow boolean operators, hence general searches on attributes and combinations
of attributes is not supported. However, it is possible to search by Rank and
Taxonomic name.
Some topologies queries fall under
attribute dependant queries because all trees/sub-trees have at least one
attribute: their number of nodes!
- Number of nodes in a tree, or sub-tree? e.g.
How many animal?, how many mammals?
At present we do not count the number of
nodes in a sub-tree, although this could be implemented in the popup that
currently reports the path to a node.
- Comparison of branches of the tree (i.e.
sub-trees with most nodes)? e.g. Is there more mammals or fish?
Again, we do not count the number of nodes
in a sub-tree. Questions of this nature could be answered using the current
version of the software, but answers would be obtained by manual inspection of
the displayed hierarchies.
- Largest fan-out e.g. What is the largest
group of animals with same lineage?
Counting nodes is not a feature that is
requested by our intended audience – taxonomists, hence we have not
implemented this feature yet.
Known items
- Which node(s) has a label containing this
string? e.g. find "giraffe" in a tree of animals
This is implemented in the Search
panel.
- Locate a node knowing its path.
If you know the path to a node then you can
find it simply by expanding parent nodes sequentially until the node is found.
- Go back to a node you have visited before.
At present we do not have a history or
bookmark mechanism, although we can appreciate the utility of such a facility
in a tree exploration and navigation context.
Labeling
- Review all the labels in a sub-tree
Lists of names are important to taxonomists
(e.g. a list of the members of a genus). At present this is supported through
the hierarchy comparison panel, and in the appropriate Assignment Table tab
(e.g. the Common Nodes tab if all the nodes in the sub-tree are common to both
trees).
Browsing
- Explore the tree by performing a series of
up and downs in the tree e.g. you are looking for a cute animal... so you look
into mammals, then primates, then gorillas, and chimpanzees, but you realize
that are not that cute, so you go to felines, to tigers and cheetahs, but now
remember that pandas are your favorites and you go there.
When we first explored the InfoVis data
sets, we realized that one of the major issues would be supporting navigation
in large data sets, as opposed to comparison of hierarchies within the data
sets. Targeted navigation using the Search panel and Assignment Table are
supported, but browsing, as characterized above, is not supported beyond
expanding and collapsing nodes of interest. Of course, individual and
synchronous scrolling of the hierarchy display panes is also supported.
Managing the analysis
- Marking nodes of interest, removing special
anomalies.
Marking nodes of interest has not been
implemented yet, although we can appreciate the utility of being able to
bookmark or otherwise highlight such nodes. The second issue, of being able to
remove special anomalies requires that issues of maintaining an audit trail be
addressed, such as recording who made which modifications to a node, and
when.
- Saving visualization settings for future
reference.
Not yet implemented.
- Keeping the history of your analysis,
reviewing it and replaying it with different parameters.
Again, not implemented yet.
|
- To what extent are the differences in the
classifications due to differences in how animals are thought to be related?
Are there other kinds of differences and can you explain them?
All taxonomic classifications are based on
some assessment of relationship, either phenetic or phylogenetic:
consequentially all differences are attributable to differences in these
relationships. Where classifications are formed from quite different
relationship models, particularly phylogenetic and phenetic, it can be
particularly difficult to map classifications one onto another, and therefore
difficult to explain individual differences. As in all systematics, it is
easier to explain differences when both the relationship model and taxa are
similar.
We suspect that this question specifically
means phylogenetic relationship rather than relatedness in general. It is
crucial to know whether the hierarchies analysed were phylogenetically derived
in order to answer this question and such information was not included in the
dataset.
Considering one dataset or the other:
- Can you say in how many different subtrees a
particular common name (such as "dolphin" or "horse") is used? How closely are
these animals related? Are common names a good guide to understanding
relationships?
We have not implemented common name
management at this stage of development of our user interface, although they
exist in our data model. Our data structures allow for searching of individual
names, as exemplified in question 3 below, so determining how many times a name
occurs is straightforward. The question of subtrees, though, is intriguing: we
have not found a method of identifying sub-trees without user-intervention,
beyond the trivial set of sub-trees created at each node. Users can be shown
each instance of the target name and can manually identify the sub-tree to
which they belong but without the ability to identify such sub-trees, our
software is unable to answer this query automatically.
The question of degree of relatedness of
two taxa is probably best assessed by determining their lowest common
root–node. Such information could be expressed as the rank of the taxon
immediately below the common root node (for instance belonging to different
Classes) and as such would be most easily accessible to a wide audience. Our
software is able to display the hierarchies necessary to determine these ranks,
but is not set up to calculate the lowest common root of a pair of taxa.
Shared common names are not a good guide to
phylogenetically related taxa, but they might indicate an ecological
relationship of some sort, such as "horse" and "horse fly".
- How many species or subspecies are named
after biologists named "Townsend"? Note that the answer will be different if
you are looking at common names versus Latin names. Can you look at the pattern
of names to deduce where in the world they might have done research? On what
kinds of animals?
Within the Mammalia data there are 9 taxa
containing the string "townsend" using wildcard completion of the name,
although such names may have been given for a geographical location rather than
a biologist: the data set does not contain the information to discriminate
these cases. These taxa are highlighted in the Hierarchy Comparison panel. The user can assess
the hierarchical position of each instance by inspection, which will inform the
educated user of the kind of animal involved. (Our software is intended as a
tool for taxonomists and not for naïve users.) Information on the
geographical origin of these taxa are not included in the hierarchical data
sets, so the user would have to use the names recovered in other search engines
to resolve queries beyond the scope of hierarchical comparison.
- Some scientific names are maddeningly
similar. For example, Spirulida and Spirurida are two nodes in two different
subtrees. A user types in the wrong one. What kind of feedback does your tool
provide to alert the user quickly? Do the names have the same rank? Is the
typed name in the expected part of the tree?
Our software allows users to select taxa
either by pointing at the hierarchy or at a name-list or by typing in the name
of the query taxon. When the user types names that exists in the data set, the
software will display the local region of the hierarchy: if the name was not
the one intended the user must recognise the fact from the hierarchy displayed.
The software does not provide any scheme for highlighting taxa with similar
names. Again we point out that our software is intended for taxonomists not
naïve users.
- For the top five subtrees with the most
nodes—are they likely to have a parent of a particular rank? Or does this
happen in many ranks? Can you comment on how useful "rank" is?
Our software is unable to detect sub-trees
automatically, beyond the trivial case where each node is the root of a
sub-tree. This question seems to be asking whether the density of taxa in a
tree is evenly distributed or whether some regions are highly differentiated
into a large number of taxa. Such phenomena are readily seen by reducing the
scale of the hierarchy display, although this facility is not included within
our software. The question appears to wish to explore the evenness of
distribution in both the vertical (with rank) and horizontal (number of taxa at
any rank) directions. Such analytical facility has not been included in our
software, which is focussed on comparison between hierarchies rather than
analysis of individual hierarchies.
Rank is an essential property of a nested
hierarchy, being simply a measure of the degree of nesting. Rankless ordering
such as that based on the concept of clades is an alternative means of managing
statements of relationship, but it can work at only one level and cannot form
an hierarchical classification. Our software is ultimately intended to manage
nomenclature and this component is designed to compare hierarchies.
Phyolgenetic trees are, as such, beyond the scope of the software.
|